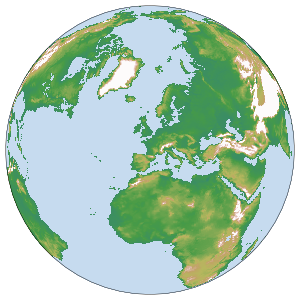
Welcome to the PRIMAVERA User Interface Platform. The aim of this website is to disseminate the results of the project to users and potential users. The new climate information arising from PRIMAVERA high resolution simulations is presented in the context of different impact sectors. Also, specific results are presented in an interactive way by using storymaps. As the project is still ongoing, new content will be added regularly.
Hit play if you want to know about PRIMAVERA in detail. Below you will find an example of the increase in detail that high resolution (right, 25 km aprox.) can provide, when compared with a coarser resolution (left, 130 km aprox.). The field plotted is the topography of the HadGEM global climate model.
Below is an example of the increase of the detail that high resolution (right, 25 km aprox.) can provide, compared with a coarser resolution (left, 130 km aprox.). The field plotted is the topography of the HadGEM global climate model.
Data Viewer
The PRIMAVERA Data Viewer is a visual prototype that explores some of the PRIMAVERA project results obtained from different Global Climate Models (read more about the climate models used in PRIMAVERA here). The aim of the prototype is to illustrate the climate model results obtained from different models and resolutions. We selected a few well known climate indices to illustrate the data. At the moment, the Data Viewer provides results from the past model runs (i.e. climatology) as well as the early project results from the future model runs. You can read more about the climate model simulations conducted in PRIMAVERA here.


